The Scatterplot Display Mode
There are two primary types of pseudo 2D-gel (Mw vs pI) scatterplot display modes of this derived protein expression data: expression mode or ratio mode. The expression data may be for a single sample (the current sample) or the mean expression of a list of samples (called the expression profile or EP). The ratio data is compute as the ratio of two individual samples called X and Y. Ratio data may alternatively be computed from sets of X samples and sets of Y samples. Generally, one would group a set of samples with similar characteristis together having the same condition (e.g., cancer, normal, etc.). The ratio of X and Y may be single samples in which case the ratio is computed as:ratio = (expression X / expression Y)where expression X (expression Y) is the expression of corresponding proteins. Alternatively, you may compute the ratio of the mean expression of two different sets of samples (the X set and the Y set). The X and Y sets may be thought of as experimental conditions and the members of the sets being "replicates" in some sense. E.g., the X set could be cancer samples and the Y set could be normal samples. The ratio of the X/Y sets for each corresponding protein is computed as
ratio = (mean X-set expression / mean Y-set expression)
The following shows one of the (Mw vs. pI) scatterplots when the display mode was set to (X-set/Y-set) ratio mode:
It is also possible to create an (X vs Y) scatter plot or (Mean X-set vs. Mean Y-set) scatterplot when the corresponding ratio display mode is set. The following window shows the (Mean X-set vs. Mean Y-set) scatterplot:
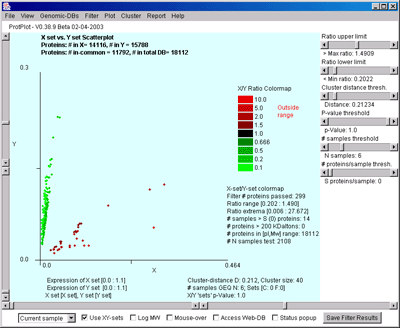
The following table summaries the four types of display modes:
| Display Mode | Current sample | Single X/Y | X-set/Y-set | EP-set |
|---|---|---|---|---|
| Expression | yes | no | no | no |
| Single samples ratio | no | yes | no | no |
| X-set and Y-set samples ratio | no | no | yes | no |
| Mean Expression | no | no | no | yes |
This may be invoked either from the File menu
or the pull-down sample selector at the lower-left corner of the main
window.
For example, you invoke this chooser for a the specific tissue sample
you want to view by using the (File menu | Select samples | Select
Current PRP sample). For X (Y) data, you invoke the choosers using
(File menu | Select samples | Select X (Y) PRP sample(s)). You may
switch between single (X/Y) and (X set/Y set) mode using the (File
menu | Select samples | Use Sample X and Y sets else single X and Y
samples [CB]) command.
There is an alternative display called the 'Expression Profile' (EP)
plot which display a list of a subset of PRP samples for the currently
selected protein. You may also display the scatterplot on the mean EP
data for all proteins. The EP samples are specified using the (File
menu | Select samples | Select Expression List of samples) command.
In the (Filter menu | State | Protein Sets) submenu there are a number
of commands to manipulate protein set files. You may individually
save (or restore) any particular saved filtered set to (or from) a set
file in the "Set" folder. There are also commands to compute the set
intersection, union or difference between two protein set files and
leave the resulting protein set in the saved Filter set.
indicate that the command
Starting ProtPlot by clicking on the ProtPlot startup icon will not
read the state file when it starts up. However, if you have saved a
state, clicking on the state file or a shortcut to the state file will
cause it to be read when ProtPlot starts up.
You may save the current state using either the (File | State | Save
State) command to save it under the current name, or using either the
(File | State | Save As State) command to save it under a new name you
may specify. Then you may also change the current state using (File |
State | Open Statefile) command.
You may scroll the scatterplot in both the pI and Mw axes by
adjusting the end-point scrollbars on the corresponding axes. You may
display the scatterplot with a log transform of MW by toggling the
log MW switch.
The popup plots and scatterplot may be saved as .gif image files which
are put into the project's "Report" folder. Similarly, reports are
saved as tab-delimited .txt text files in the "Report" folder.
Because it prompts you for a file name, you may browse your file
system and save the file in another disk location.
The cluster distance metric is the 'distance' between two
proteins based on their expression profile. The metric may be selected
in the Cluster Menu. Currently, there is one clustering method:
cluster proteins most similar to the current protein (specified by
clicking on a spot in the scatterplot or using the Find Protein by
name in the Files menu). It requires you to specify a) the current
protein, and b) the threshold distance cutoff. The threshold distance
is specified interactively by the "Distance Threshold T" slider. The
'Similar Proteins Cluster' Report will be updated if you change either
the current protein or the cluster distance.
The cluster distance metric must be computed in a way to take missing
data into account since a simple Eucledian distance can not be used
with the type of sparse data present in the ProtPlot
database. ProtPlot has several ways to compute the distance metric
using various models for handling missing data.
You may save the set of proteins created by the current clustering
settings by pressing the "Save Cluster Results" button in the
lower-right of the cluster report window. This set of proteins is
available for use in future data filtering using the (Filter menu |
Filter by AND of Saved Clustered proteins [CB]). When you save the
state of the ProtPlot database (Filter menu | State | Save State), it
will also save the set of saved clustered proteins in the database
"Set" folder. You may restore any particular saved clustered set
file.
You may bring up the EP plot window by clicking on the "EP Plot"
button and then click on any spot in the scatterplot to see its
expression profile. Clicking on the "Scroll Cluster EP Plots" button
brings up a scrollable list of expression profiles for just the
clustered proteins sorted by similarity.
The following window illustrates the scrollable list of EP plots
sorted by the current cluster report similarity.
You may mark the proteins belonging to the cluster in the scatterplot
with black boxes by selecting the "
Revised: 08-26-2004
Effect of display mode on filtering, clustering and reporting
You select the particular display mode using the Plot menu
comands. When you select a particular display mode, it will enable and
disable Filter, View, Cluster and Report options depending on the
mode. For example, you may only use the t-Test or missing X Y set test
if you are in XY-sets ratio mode. You may only perform clustering if
you are in EP-set mode. You may change the display mode using the
(Plot menu | Show display mode) commands. Alternatively, since it is
used so often, there is a checkbox at the bottom of the main window
"![]() Use XY-sets" that will
toggle between the XY-sets ratio mode and whatever the previous mode
you had set.
Use XY-sets" that will
toggle between the XY-sets ratio mode and whatever the previous mode
you had set.
Selecting Samples
You select samples for the current sample, X sample, Y sample, X-set
samples, Y-set samples, and EP-set samples using a popup checkbox list
chooser of all samples. 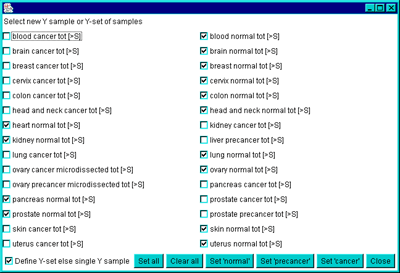

Listing a report on sample assignments
You may popup a report of the current sample assignments for the:
current sample single X sample, single Y sample, X sample set, Y
sample set, and EP sample set using the (File menu | Select samples |
List sample assignments) command.
Assigning the X-set and Y-set condition names
The default experimental condition names for the X and Y sample
sets are 'X set' and 'Y set'. You may change these by the (File menu |
Select samples | Assign X (Y) set name) commands.Status Reporting Window
There is a status popup window that first appears when the program is
started and reports the progress while the data is loading. After the
data is loaded, it will disappear. You may bring it back at any time
by toggling the "![]() Status
popup" checkbox at the bottom of the window. You may also press the
"Hide" button on the status popup window to make it disappear.
Status
popup" checkbox at the bottom of the window. You may also press the
"Hide" button on the status popup window to make it disappear.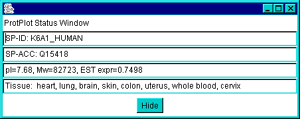
Data Filtering
The pseudo-protein data is passed through a data filter consisting of
the intersection of several tests including: pI range, MW range,
sample expression range, expression ratio(X/Y) range (either inside or
outside the range), t-Test comparing the X and Y sample sets,
Kolmogorov-Smirnov test comparing the X and Y sample sets, missing
proteins test for X and Y sample sets, tissue type filter, protein
family filter [Future], and clustering. The filtering options are
selected in the Filter menu. If you are looking at the scatterplot in
ratio mode, then you may filter by ratio of X/Y either inside or
outside of the ratio range. The missing protein test defines missing
as totally missing and present as having at least 'N' samples
present. Note that the t-Test and the missing protein test are
mutually exclusive in what they are looking for, so using both results
in no proteins found.Saving filtered proteins in sets for use in subsequent data filtering
You may save the set of proteins created by the current data filter
settings by pressing the "Save Filter Results" button in the
lower-right of the main window. This set of proteins is available for
use in future data filtering using the (Filter menu | Filter by AND of
Saved Filter proteins [CB]). When you save the state of the ProtPlot
database (Filter menu | State | Save State), it will also write out
the save protein sets (saved filtered proteins and saved clustered
proteins) in the database "Set" folder with ".set" file name
extensions. Filter dependence on the display mode
Note that the particular filter options available at any time depend
on what the current display mode is. The following table shows which
options are available for which display modes.
Filter Name
Current sample
Single X/Y
X-set/Y-set
EP-set
> 200K Daltons
yes
yes
yes
yes
Tissue type
yes
yes
yes
yes
Expression (Ratio) range
expression
ratio
ratio
expression
X/Y (inside/outside) range
no
yes
yes
no
(X-set, Y-set) t-Test
no
yes
yes
no
(X-set, Y-set) KS-Test
no
yes
yes
no
(X-set, Y-set) Missing data
no
yes
yes
no
At Most (Least) N samples
no
no
yes
yes
AND of saved cluster set
yes
yes
yes
yes
AND of saved filter set
yes
yes
yes
yes
The data-mining 'State'
The current data-mining settings of ProtPlot is called the 'state'. It
may be saved in a named startup file called the 'startup state file'
in the "State" folder. The "State" folder and other folders used by
ProtPlot are found in the directory where you installed
ProtPlot. Initially there is no startup state file. If you save the
state it creates this file. You may create as many of these saved
state files as you want. You may change the file and thus save various
combinations of settings of samples for the current, X, Y and
expression list of samples. The state also includes the the various
filter, view and plot options as well as the pI, Mw, expression,
ratio, cluster distance threshold, number samples threshold, p-Value
threshold sliders, as well as other settings. The saved Filter and
Cluster sets of proteins are also written out as .set files in the
"Set" folder when you save the state.The Molecular Mass vs pI Scatterplot : expression or ratio
There are to types of scatterplots: expression for a single sample or
the ratio of 2 samples X and Y. The Plot menu lets you switch the
display mode. Ratio mode itself has two types of displays: red(X) +
green(Y), or a ratio scale ranging between <1/10 (green) and >10
(red). You may view a popup report of the expression or ratio values
for the current protein. If 'Mouse-over' is enabled, then moving the
mouse over a spot will show the name of the protein and its associated
data. If mouse over is not enabled, then clicking on the spot will
show its associated data.X sample(s) vs Y samples scatterplot
If you are in X/Y ratio mode (single X/Y samples or X-set/Y-set
samples), you may view a scatterplot of the X vs Y expression
data. Enable the XY scatterplot using the (Plot menu | Display (X vs
Y) else (Mw vs pI) scatterplot - if ratio mode [CB]). You may zoom the
scatterplot just as you do for the (Mw vs pI) scatterplot. The
proteins displayed are those passing the data filter that have both X
and Y data (i.e., expression is > 0.0).Expression Profile plot of a specific protein
An expression profile (EP) shows the expression for a particular
protein for all samples that have that protein. The (Plot menu |
Enable expression profile plot) pops up a EP plot window and displays
the EP plot for any protein you select by clicking on it. The relative
expression is on the vertical axis and the sample number on the
horizontal axis. Pressing on the "Show samples" button pops up a list
showing the samples and their order in the plot. Pressing on the "nX"
button will toggle through a range of magnifications from 1X through
50X that may be useful in visualizing low values of expression.
Clicking on a new spot in the (Mw vs. pI) scatterplot will change the
protein being displayed in the EP plot. Within the EP plot display,
you may display the sample and expression value for a plotted bar by
clicking on the bar (which changes to green with the value in red at
the top). You may save the EP plot as a GIF file. You may also click
on the display to find out the value and sample. Note: since
clustering uses the expression profile, you must be in 'mean EP-set
display' mode.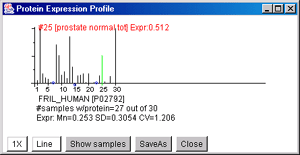
Clustering of expression profiles
You may cluster proteins by the similarity of their expression
profiles. First set the plot display mode to "Show mean EP-set samples
expression data". The clustering method is selected from the Cluster
menu. Currently there is one cluster method. Others are planned.
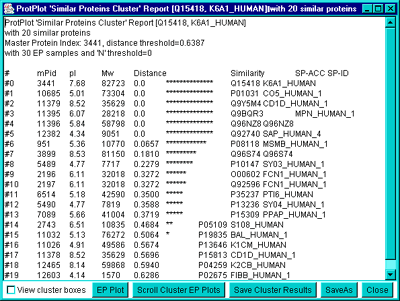
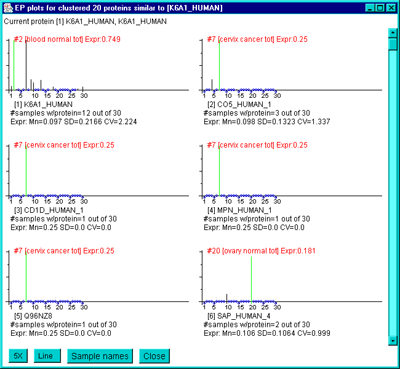
![]() View cluster boxes" checkbox at the lower left of the
cluster reportwindow. This is illustrated in the following window:
View cluster boxes" checkbox at the lower left of the
cluster reportwindow. This is illustrated in the following window:![]()
Reports
Various popup report summaries are availble depending on the display
mode. All reports are tab-delimited and so may be cut & pasted
into MS Excel or other analysis software. Reports also have a 'Save
As' button so you can save the data into a tab-delimited file. The
default /Report directory is in the directory where you installed
ProtPlot. However, you may save it anywhere on your file system. The
contents of some reports depends on the particular display mode. This
is summarized in the table below.
Filter Name
Current sample
Single X/Y
X-set/Y-set
EP-set
Statistics or proteins passing filter
SP-ACC/ID, pI, Mw, expression
SP-ACC/ID, pI, Mw, X/Y, X, Y expr, Tissues
SP-ACC/ID, pI, Mw, mnX/mnY, (mn,sd,cv,n) expr for X- &
Y-sets, Tissues. If using t-test then (dF, t-stat, F-stat). If
using KS-test then (dF, D-stat)
SP-ACC/ID, pI, Mw, (mn,sd,cv,n) exprfor EP-set, Tissues
Expression profiles of proteins passing filter
SP-ACC/ID, expr data EP-set
SP-ACC/ID, expr data EP-set
SP-ACC/ID, expr data EP-set
SP-ACC/ID, expr data EP-set
X &Y sets of missing proteins pasing filter
no
no
SP-ACC/ID, (mn,sd,cv,n)for X- & Y-sets
no
EP set statistics of proteins passing filter
no
no
no
SP-ACC/ID, (mn,sd,cv,n) for EP-set
List of samples in current EP profile
{Nbr, sample-name, expression)
{Nbr, sample-name, expression)
{Nbr, sample-name, expression)
{Nbr, sample-name, expression)
List of all sample assignments
Current, X, Y, X-set, Y-set, EP-set
Current, X, Y, X-set, Y-set, EP-set
Current, X, Y, X-set, Y-set, EP-set
Current, X, Y, X-set, Y-set, EP-set
List of # proteins/sample
{Sample-name, # proteins in sample}
{Sample-name, # proteins in sample}
{Sample-name, # proteins in sample}
{Sample-name, # proteins in sample}
ProtPlot state
State
State
State
State
Genomic Databases
If you are connected to the Internet and have enabled ProtPlot to
'Access Web-DB', then clicking on a protein will popup a genomic
database entry for that protein. The particular genomic database to
use is selected in the Genomic-DB menu.
Peter Lemkin,
LECB, NCI-Frederick