|
Revision history | PRP file format | PDF documents | History of ProtPlot | Latest version |
These controls are shown in the following figure:
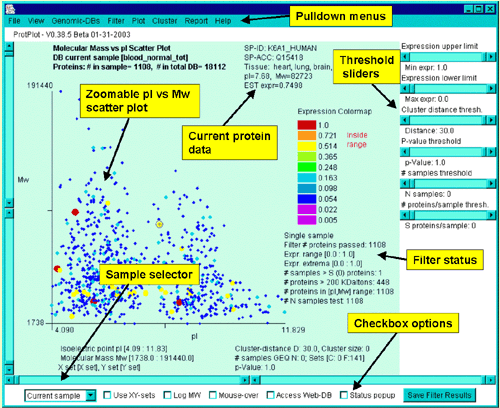
Interrogating the database by clicking on a spot in the scatterplot
You may interrogate the database by clicking on a spot in the scatter
plot. This will report data for that protein in the upper right part
of the scatterplot window. The actual data reported depends on which
display mode you have
selected. All entries show the SP-ACC and SP-ID. Additional data is
added depending on the display mode:
These lower controls include:
There are a number of pull-down menus in ProtPlot including:
Mw and pI upper and lower limits sliders
The upper and lower limits of Mw and pI may be controlled directly
thorugh sliders on the left and right respectively as shown in the
following figure.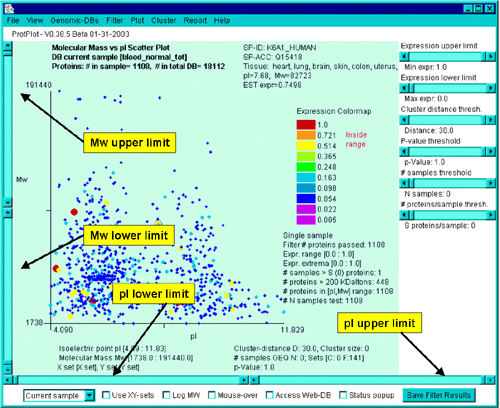
The continuous parameter threshold slider controls
Parameters may be defined interactively using direct manipulation
sliders on the right side of the main window. These right slider
controls include:

Samples menu and checkboxes in the lower command bar
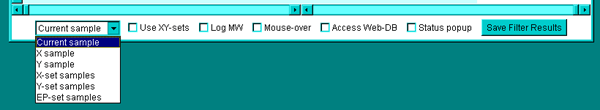
![]() Use XY-sets - this toggles between the
ratio (Mean X-set / Mean Y-set) of samples mode and the previous
display mode
Use XY-sets - this toggles between the
ratio (Mean X-set / Mean Y-set) of samples mode and the previous
display mode
![]() Expression - this toggles the
displaying the spots in the pseudo 2D-gel as colored expression values
or simply location
Expression - this toggles the
displaying the spots in the pseudo 2D-gel as colored expression values
or simply location
![]() Low Mw - this toggles displaying the
Mw scale as a log(Mw)
Low Mw - this toggles displaying the
Mw scale as a log(Mw)
![]() Mouse-over - this toggles the
mouse-over option. Holding the mouse over a spot will display its
annotations
Mouse-over - this toggles the
mouse-over option. Holding the mouse over a spot will display its
annotations
![]() Status popup - this toggles the popup
status window on and off
Status popup - this toggles the popup
status window on and off
Pull-down menu commands in the upper menu bar
The top pull-down menu selections include commands which invoke an
action, checkbox options [CB] which are independent of one another,
and radio button options [RB] which may only have one member active at
a time. Menu entries followed by the ![]() symbol, indicate that
the menu entry has a submenu. Selections prefaced with a '
symbol, indicate that
the menu entry has a submenu. Selections prefaced with a '![]() ' and indicate '
' and indicate '![]() '
indicate that the command is a checkbox that is enabled and disabled
respectively. Checkbox menu items have a "[CB]" at the end of the
command. Selections prefaced with a '
'
indicate that the command is a checkbox that is enabled and disabled
respectively. Checkbox menu items have a "[CB]" at the end of the
command. Selections prefaced with a '![]() ' and indicate '
' and indicate '![]() ' indicate that the command is a multiple
choice "radio button" that is enabled and disabled respectively, and
that only one member of the group is allowed to be on at a time.
Radio button menu items have a "[RB]" at the end of the
command.
' indicate that the command is a multiple
choice "radio button" that is enabled and disabled respectively, and
that only one member of the group is allowed to be on at a time.
Radio button menu items have a "[RB]" at the end of the
command.
File menu
This provides commands to select samples for the current, X, Y, X- and Y-sets,
and EP-set of samples. It invokes a popup sample chooser. Find a
protein by SwissProt Accession number (SP-ACC) or SwissProt ID
(SP-ID). Save and restore the data-mining state. Update ProtPlot and
its data from the Web server.
![]()
------------------
![]()
![]()
![]()
-------------------
![]()
---------------------
View menu
Specify various scatterplot viewing options.
------------------
![]() Use pseudocolor for expression else grayscale [CB]
Use pseudocolor for expression else grayscale [CB]
![]() Use log of MW [CB]
Use log of MW [CB]
![]() Enable mouse-over to see data [CB]
Enable mouse-over to see data [CB]
![]() Show expression data else just position [CB]
Show expression data else just position [CB]
![]() Use radius proportional to expression else constant [CB]
Use radius proportional to expression else constant [CB]
![]() Show clustered proteins by black boxes [CB]
Show clustered proteins by black boxes [CB]
![]() Show all X and Y samples if doing X/Y filtering [CB] - this works with either single samples or sets of sample.
Proteins missing in the X sample are shown as a gray '+' and th0se
missing from the Y sample are shown as gray boxes.
Show all X and Y samples if doing X/Y filtering [CB] - this works with either single samples or sets of sample.
Proteins missing in the X sample are shown as a gray '+' and th0se
missing from the Y sample are shown as gray boxes.
![]() Auto-update reports if state changes [CB]
Auto-update reports if state changes [CB]
Genomic-DBs menu
This connects ProtPlot with various Genomic databases. If enabled, it
will pop up a Web browser for the selected protein on the specified
Genomic database.
![]() Access a genomic Web server if you click on a spot [CB]
Access a genomic Web server if you click on a spot [CB]
------------------
![]() Use Swiss-Prot Web server [RB] - data base to use when select a spot
Use Swiss-Prot Web server [RB] - data base to use when select a spot
![]() Use PIR ProClass Web server [RB] - data base to use when select a spot
Use PIR ProClass Web server [RB] - data base to use when select a spot
Filter menu
Select the data filter options. If you change an option or adjust a
parameter slider, it will re-run the data filter. See table of filters as
a function of display mode.
![]() Filter proteins > 200K Daltons [CB] - enable to use all proteins, otherwise just use those below 200K Daltons
Filter proteins > 200K Daltons [CB] - enable to use all proteins, otherwise just use those below 200K Daltons
![]() Filter data by protein families [CB] [FUTURE]
Filter data by protein families [CB] [FUTURE]
![]() Filter data by tissue types [CB] - to filter by a subset of tissues
Filter data by tissue types [CB] - to filter by a subset of tissues
![]() Filter data by expression (or ratio) range [CB]
Filter data by expression (or ratio) range [CB]
![]() Filter by (X/Y) outside [minRatio:MaxRatio] sliders [CB] - only for ratio mode
else filter by inside ratio range
Filter by (X/Y) outside [minRatio:MaxRatio] sliders [CB] - only for ratio mode
else filter by inside ratio range
![]() Filter by X & Y sets t-test results [CB] - do t-test if using X and Y sets
Filter by X & Y sets t-test results [CB] - do t-test if using X and Y sets
![]() Filter by X & Y sets Kolmogorov-Smirnov test results [CB] - do test if using X and Y sets
Filter by X & Y sets Kolmogorov-Smirnov test results [CB] - do test if using X and Y sets
![]() Filter by X & Y sets missing and > N samples [CB] -
present in X or Y set with > N samples using the slider 'N' and
is completely missing in the other set
Filter by X & Y sets missing and > N samples [CB] -
present in X or Y set with > N samples using the slider 'N' and
is completely missing in the other set
------------------
![]() Filter by requiring at least N samples [RB] - using the slider 'N'
Filter by requiring at least N samples [RB] - using the slider 'N'
![]() Filter by requiring ayt most N samples [RB] - using the slider 'N'
Filter by requiring ayt most N samples [RB] - using the slider 'N'
------------------
![]() Filter by Saved Clustered proteins [CB] - the
clustered proteins set may be created when doing clustering by pressing the
"Save Cluster Results" when clustering
Filter by Saved Clustered proteins [CB] - the
clustered proteins set may be created when doing clustering by pressing the
"Save Cluster Results" when clustering
![]() Filter by Saved Filtered proteins [CB] - the
filter proteins set may be created by pressing the "Save Filtered Results"
Filter by Saved Filtered proteins [CB] - the
filter proteins set may be created by pressing the "Save Filtered Results"
Plot menu
Specify the scatterplot display. Switching from expression data to
ratio data changes the expression range sliders to ratio range sliders
(and vice-versa). The Expression Profile plot is enabled from this
menu. See table of
filters for a discussion on display modes.
![]() Show current sample expression data [RB]
Show current sample expression data [RB]
![]() Show mean EP-set samples expression data [RB]
Show mean EP-set samples expression data [RB]
![]() Show X-sample/Y-sample ratio (Red=X + Green=Y) data [RB]
Show X-sample/Y-sample ratio (Red=X + Green=Y) data [RB]
![]() Show X-sample/Y-sample ratio range color map [RB]
Show X-sample/Y-sample ratio range color map [RB]
![]() Show X-Set-samples/Y-Set-samples ratio range color map [RB]
Show X-Set-samples/Y-Set-samples ratio range color map [RB]
------------------
![]() Display (X vs Y) else (Mw vs pI) scatterplot - if ratio mode [CB] -
if in X/Y or X-set/Y-set ratio display mode, then display the X-Y
scatterplot instead of the Mw vs. pI scatterplot.
Display (X vs Y) else (Mw vs pI) scatterplot - if ratio mode [CB] -
if in X/Y or X-set/Y-set ratio display mode, then display the X-Y
scatterplot instead of the Mw vs. pI scatterplot.
------------------
![]() Popup Expression Profile plots [CB] - you
may adjust the zoom by clicking on the 1X button. Clicking on a sample bar
shows what the sample is and its value. Selecting another protein in the
scatterplot will change the EP plot.
Popup Expression Profile plots [CB] - you
may adjust the zoom by clicking on the 1X button. Clicking on a sample bar
shows what the sample is and its value. Selecting another protein in the
scatterplot will change the EP plot.
Cluster menu
Initiate clustering. Specify the distance metric. When clustering is
enabled, the Cluster Distance Slider (D) is active. After you have
defined an initial cluster, you may popup up a scrollable list of EP
plots for the clustered proteins. These are sorted by the similarity
order in the cluster
report
Djamel Medjahed, LMT, SAIC-Frederick
Revised: 08-26-2004