Computing the Estimated EST Expression
 **** This page is under construction *****
The CGAP tissue and histologic database
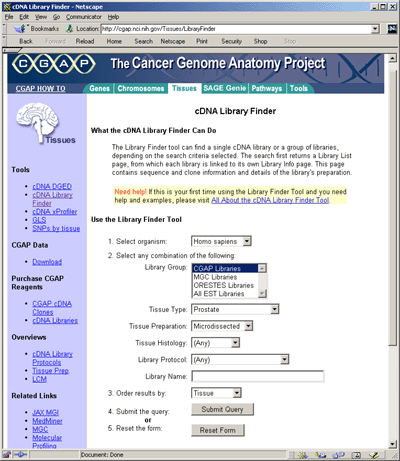
For each tissue, the NCI Cancer Genome Anatomy Program (CGAP database) may be queried by
possible histological state, source, extraction and cloning method.
In the initial query on the CGAP Web site, selecting the option "ANY"
for all fields provides an initial overview of the available
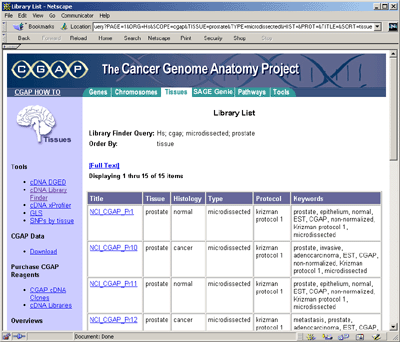
libraries. The more restrictive a search, the fewer the number of
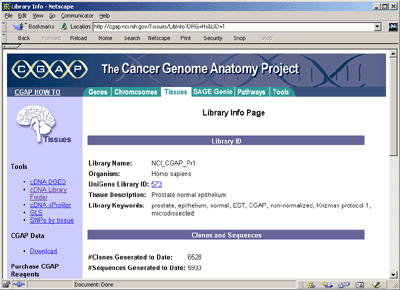
libraries that are selected. Within each library, transcripts are
listed along with the number of times they were detected after a fixed
number of PCR cycles.

As we were primarily interested in computing protein maps, using
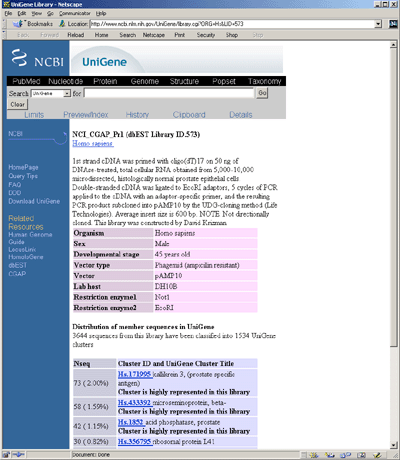
UniGene we extracted gene symbols associated with those CGAP EST's
that were clustered to a gene of known function. To restate this: the
CGAP Web site contains library specific expression data and the
UniGene site contains the gene cluster symbol correspondence.
Finally, the Expasy
SwissProt/trEMBL database contains gene symbols and protein sequence
data. From this, one can compute the pI and Mw.


1. Mapping Gene symbols between CGAP, UniGene and SwissProt databases
A Perl script was outputs these gene symbols from the CGAP=UniGene
derived data. This is cross=reference agains the Expasy SwissProt/trEMBL homosapiens
data set to produce a list of corresponding SwissProt accession
numbers (SP-ACC). This list can then be input to the Expasy pI/Mw tool
server to produced tab-delimited data containing the pI (isoelectric
focusing point), Molecular mass (Mw), and SwissProt ID (SP-ID) for the
mature, unmodified proteins
[Medjahed03a]. The following summarizes the steps in mapping the
annotation mapping.
- Remove all EST and empty gene symbol entries
- Sort by the Hs. UniGene identifiers
- Lookup the gene symbols in the sorted UniGene data
- Using the gene symbols, lookup (SP-ACC,SP-ID,pI,Mw)
on the Expasy.org Web site
2. Computing the estimated EST expression
We then needed to compute the estimated EST expression. In the case
of a single library, this information was computed from the
expression-detection counts. The number of hits for each CGAP EST was
first divided by the sum total of sequences within that library to
provide a relative expression for each transcript.
Then, the results were renormalized by dividing relative expression
levels by the maximum relative expression level so that the maximum
expression was normalized to 1.0. Expression values are > 0.0
(least abundent) and less than or equal to 1.0 (most abundent).
A tissue search may find several libraries fulfilling the requirements
of the initial query. Therefore, to improve the signal-to-noise
ratio, the search results were pooled to generate a non-redundant list
of entries. This leads to a more comprehensive expression map for that
tissue corresponding to that histological state.
- Pool and add CGAP libraries coresponding to the same tissue and
histological state
- Compute the relative EST frequencies from this pooled data
- Compute the maximum relative EST frequency (i.e., MaxESTexpr)
- Merge the (SP-ACC,SP-ID,pI,Mw) with the (SP-ID,MaxESTexpr)
data to generate (SP-ACC,SP-ID,pI,Mw,MaxESTexpr) data used to
for the ProtPlot master protein index.
3. Generating the ProtPlot .prp files
The resulting data is a tab-delimited '.prp' formatted file that
contains expression levels ranging from 0.0 (undetected) to 1.0 (most
abundant). The following sequence of operations is performed on each
(tissue, histological state) to create a ProtPlot sample. Each
ProtPlot sample is saved in a tab-delimited ".prp" formated file containing the
(SP-ACC,SP-ID,pI,Mw,MaxESTexpr) data.
Additional details on these methods are available in ( [Medjahed02], [Medjahed03a], [Medjahed03b]).
Djamel Medjahed,
LMT, SAIC-Frederick
Peter Lemkin,
LECB, NCI-Frederick
Revised: 08-26-2004